Among all the Long Island Sound water quality data released recently showing the summer of 2012 to have been particularly bad, there were two data sets that indicated something slightly different.
Those data sets don’t negate the evidence that it was one of the worst summers for hypoxia in years. More than 20 percent of the Sound was affected by low concentrations of dissolved oxygen in August (only three summers since 1991 were worse); and 18 square miles of the Sound off Westchester County had almost no dissolved oxygen at all in August, and therefore no fish (it was the first time since 2008 that conditions were so dire).

But the picture would be incomplete if we ignored two sets of data, contained in the 2012 Season Review compiled and distributed by the Connecticut Department of Energy and Environmental Protection.
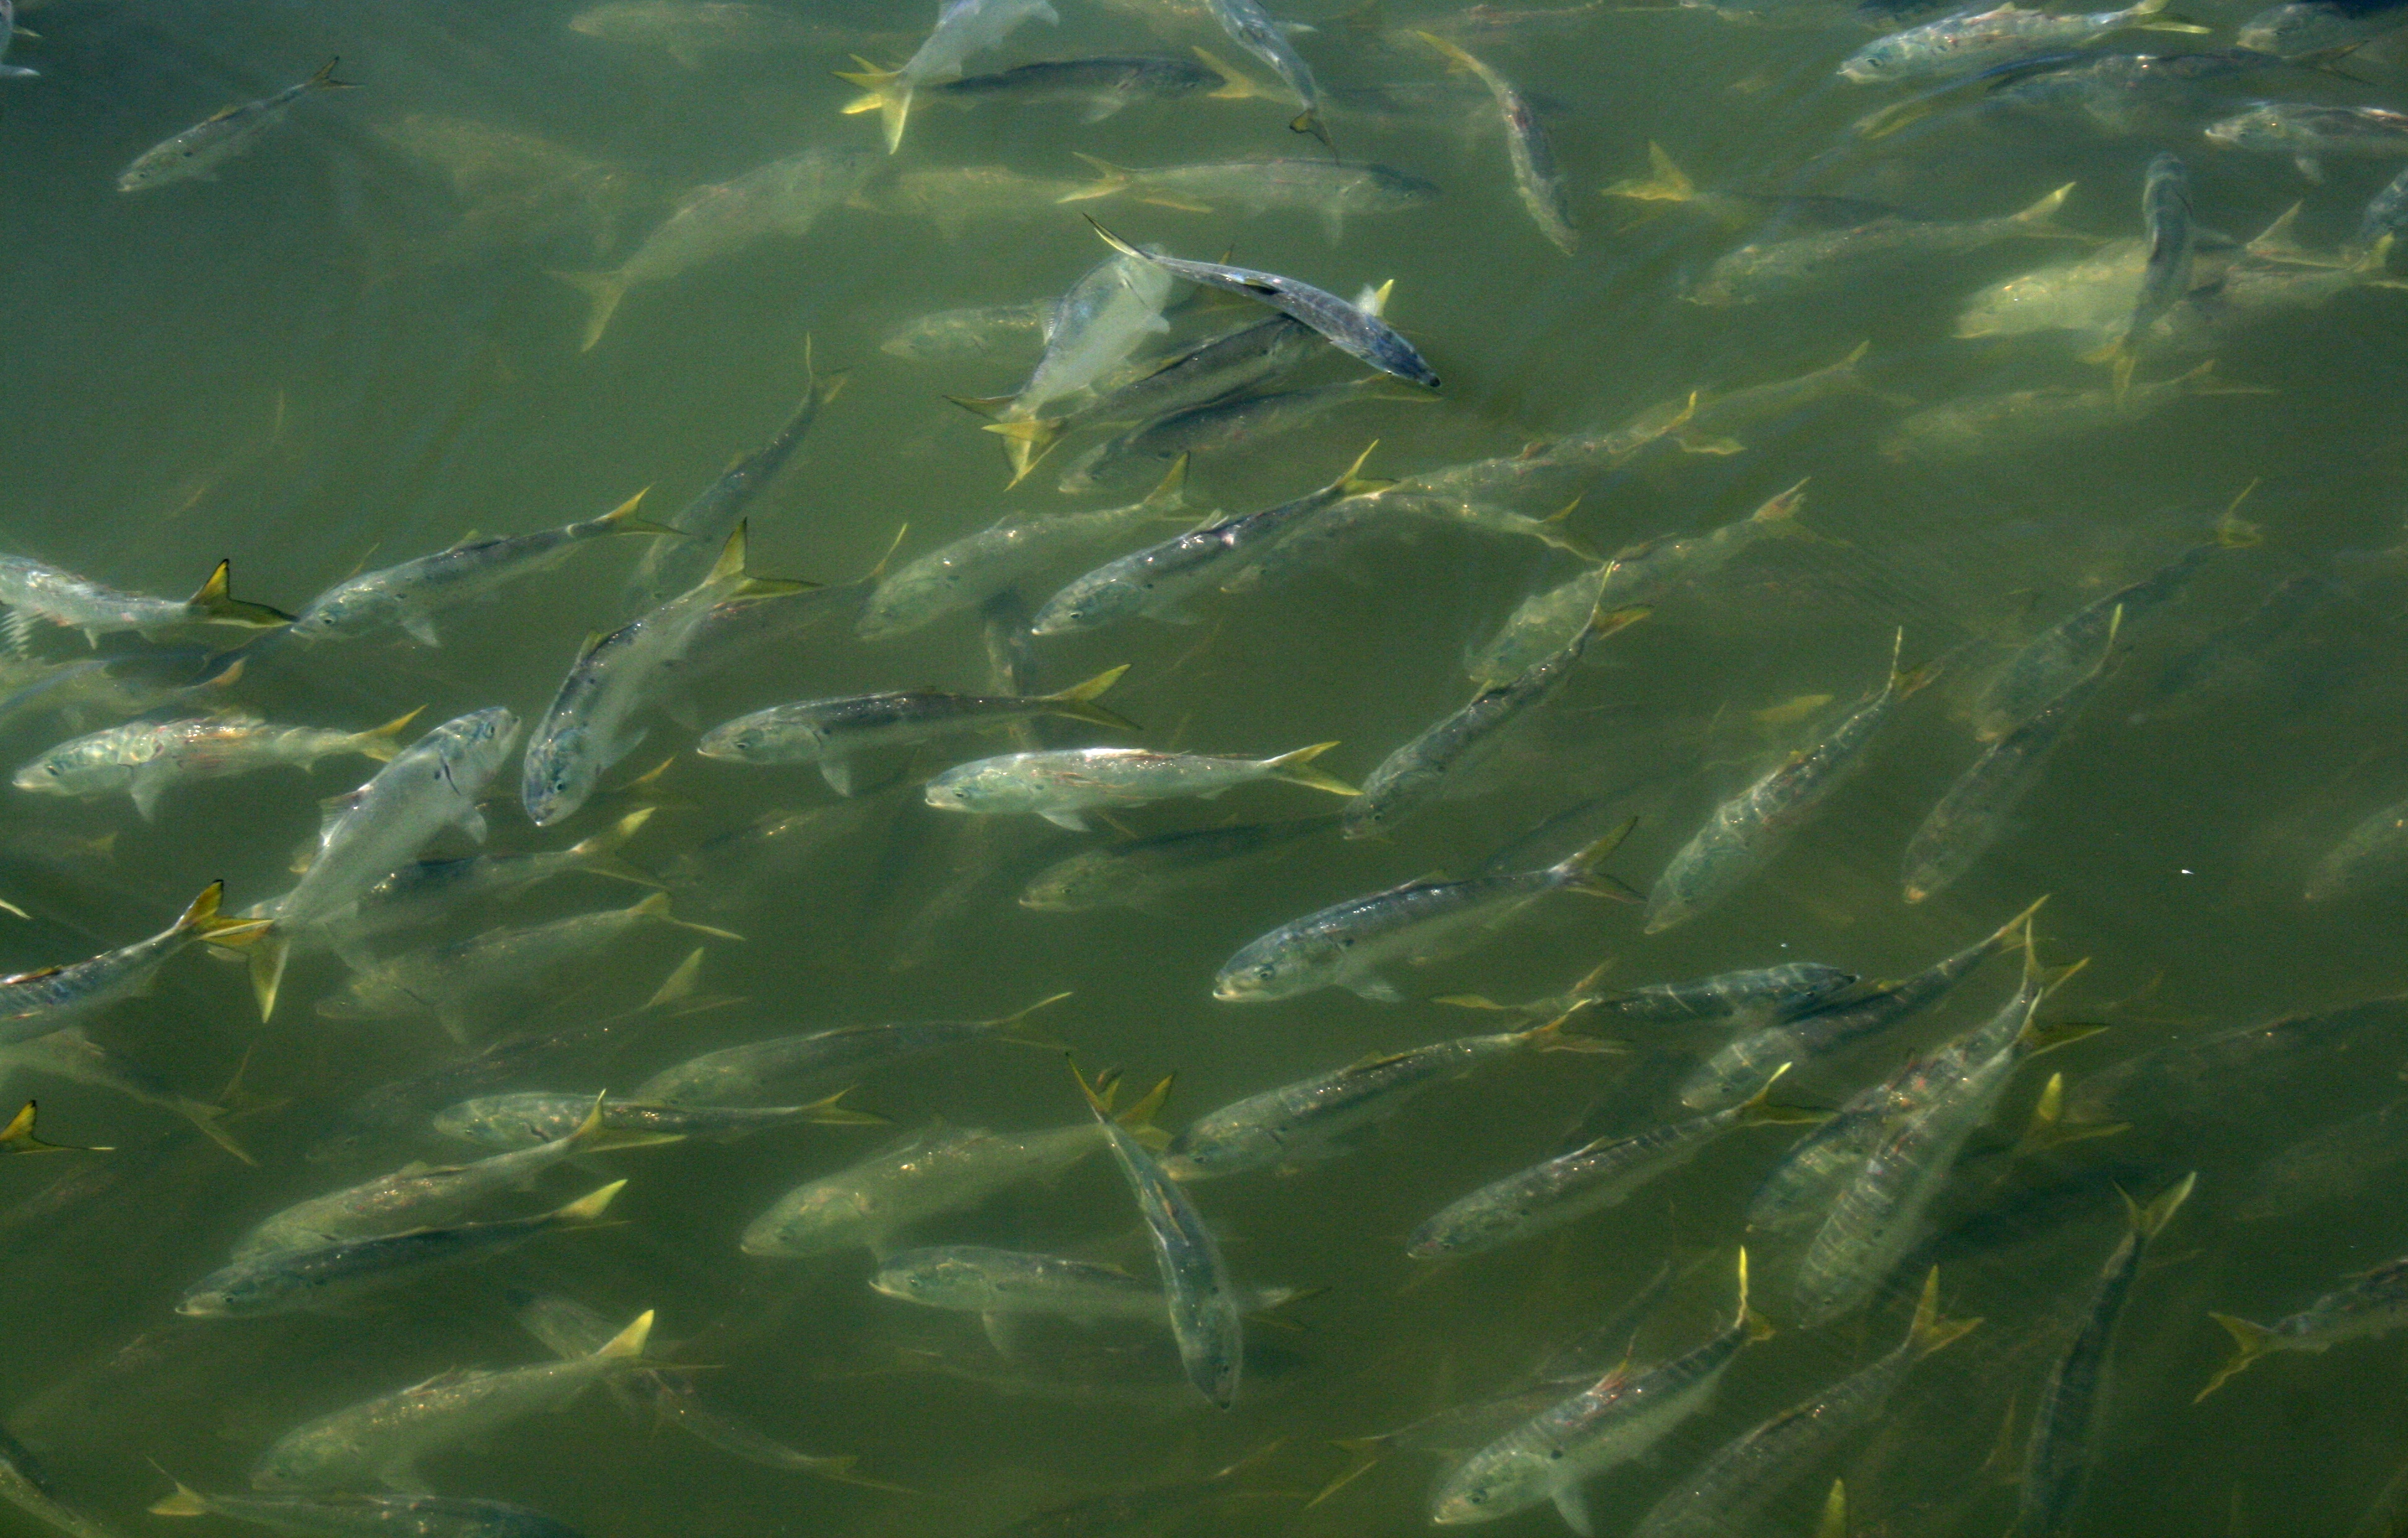
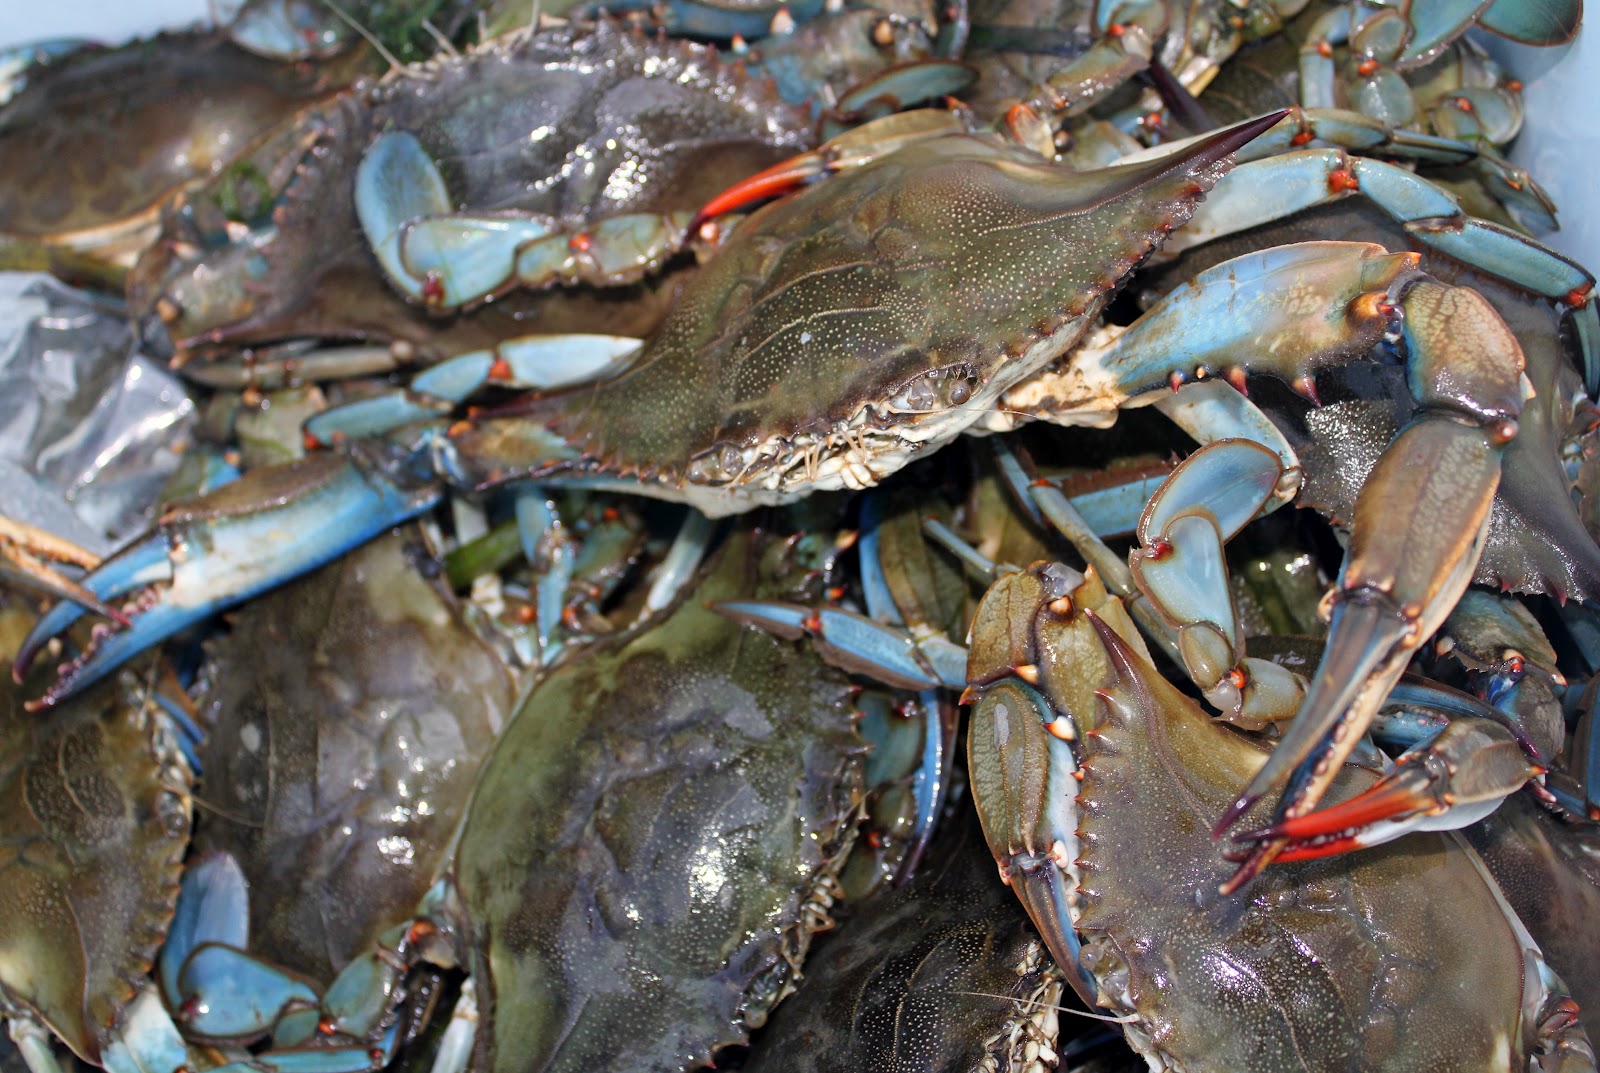
Hypoxia is a measure of habitat loss. When dissolved oxygen levels are low, fish, lobsters, crabs and other marine life can no longer live there. In a worst case, when dissolved oxygen falls to zero quickly, they die.

Photo: Kierran Broatch
But the DEEP notes that fish are harmed not just by the intensity of hypoxia but by the intensity combined with the duration of hypoxia: one week of living in waters with D.O. below 3 is worse than one day, for example.
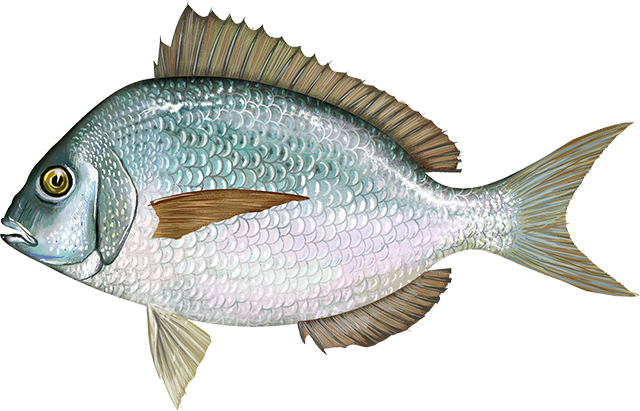
Some species are more sensitive to hypoxia than others. Scup and sea robin, for instance, require more dissolved oxygen and become less abundant when concentrations drop below 4; Atlantic herring and butterfish, on the other hand, are less sensitive and decline when concentrations drop below 2.

The DEEP developed a method of combining hypoxia’s intensity, extent and duration into an index for comparing, year by year, the amount of the Sound’s habitat impaired by hypoxia. The index is called BADD, for Biomass Area-Day Duration. It takes into account what has historically been the entire hypoxia season on the Sound, from July 10 through September 10.
Based on that index, 2012 was about average. Although hypoxia was intense and widespread in mid-August, the amount of habitat that was lost was not correspondingly large. That’s because even though hypoxia was severe in mid- August, it was not quite as severe during the weeks before and after.
Matthew Lyman, an environmental analyst for the DEEP, said in an email: “This year even with the area below 1 mg/L the BADD value was not as severe due to the short duration calculated for DO within that range. We had a small area below 2 mg/L in July followed by an increase in DO, then areas below 2 and below 1 mg/L in August again followed by a significant increase in DO and decrease in hypoxic area. Those increases in DO helped to reduce the BADD value this year.”
Since 1991, 11 years were better on the BADD index, nine were worse and one was about the same as 2012. All in all, 2012 was a so-so year – not great but not terrible.
The same can be said for another criterion developed by the DEEP, namely the level of dissolved oxygen that is completely safe for all fish, which the DEEP says is 4.8 milligrams per liter: if oxygen levels stay above 4.8, no fish are ever harmed.
Based on that criterion, 2012 was the sixth best year since 1991, with 579 square miles falling below 4.8 milligrams per liter. That means 741 of the Sound’s 1,320 square miles were completely safe for fish all the time.
We don’t believe that the BADD index or the 4.8 milligrams per liter threshold indicate that conditions in the Sound were acceptable. But they do show that the Sound is a complex ecosystem with many factors affecting various forms of life in diverse ways.
Posted by Tom Andersen, NY program and communications coordinator for Save the Sound. Tom is also the author of This Fine Piece of Water: An Environmental History of Long Island Sound.

1 thought on “Season Review: A Complex Ecosystem With Diverse Conditions”
Comments are closed.